On Tuesday night, August 11, every household in the Hawkesbury will fill in the same form as every household in the country. The Census is Australia's largest measurement exercise.
All three levels of government plan around it. Charities and community organisations use it to argue for funding. Companies use it to decide where to build a supermarket, a medical centre or a bank branch.
When Hawkesbury City Council writes its Long-Term Financial Plan, the population assumptions underpinning it trace back to this one night in August.
That makes the Census a barometer of a community's health, and a barometer is most useful when readings are compared. This report takes the macro view: the Hawkesbury compared with three of its neighbours, Penrith, The Hills and Blacktown, across the five censuses from 2001 to 2021. Next year's results will add the sixth reading.
The first comparison is the bluntest.
Twenty-five years of growth
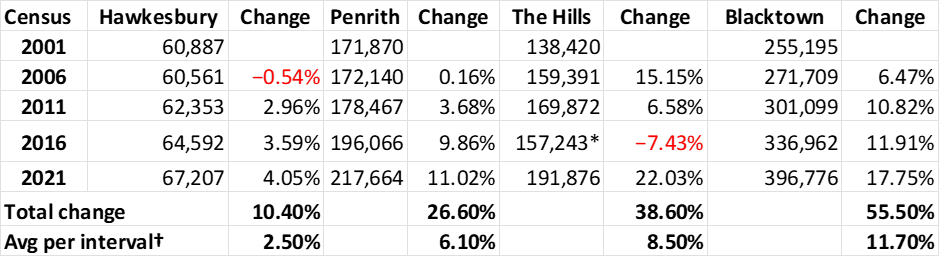
Source: ABS Census QuickStats, each census year. *The Hills' 2016 fall is a boundary change, not a decline: the suburbs south of the M2 transferred to the new City of Parramatta in May 2016. †Compound average across the four five-year intervals.
Between the 2001 and 2021 counts, the Hawkesbury added about 6,300 people. Blacktown added 141,600, more than two entire Hawkesburys. The Hills added 53,000, despite handing over a slab of its territory to Parramatta halfway through. On any reading, the Hawkesbury is the slowest-growing community in its region by a wide margin. Between 2001 and 2006, it went backwards, the only council of the four to record a real fall.
The Penrith line deserves the closest look because Penrith is the natural control group. Through the 2000s, it was as flat as the Hawkesbury: 270 extra people over five years, a growth rate of 0.16 per cent, while the nation grew by almost six. Then it turned. The release areas along its eastern and southern edges, including Jordan Springs, Caddens and the later stages of Glenmore Park, added more than 45,000 people in the decade to 2021. Two floodplain councils started the century standing still. One of them decided to move.
Whether the Hawkesbury should move is a fair question, and the honest answer is that the constraint is real. More of this district falls under flood planning controls than in any comparable part of Sydney. The flood of 1867 hangs over every rezoning debate, and after the valley flooded repeatedly in the two years to 2022, caution about putting more families on the floodplain is not timidity. It may be the most defensible position any council in this comparison holds. But a constraint honestly named is different from a constraint used as a reason not to plan, and that difference appears later in this report.
The income ladder
Growth and prosperity are not the same thing, and the income figures prove it in both directions.
|
Area |
Median weekly household income 2021 |
Annualised |
|
The Hills |
$2,831 |
$147,212 |
|
Blacktown |
$2,107 |
$109,564 |
|
Hawkesbury |
$1,980 |
$102,960 |
|
Penrith |
$1,903 |
$98,956 |
|
Australia |
$1,746 |
$90,792 |
Source: ABS Census QuickStats 2021.
All four councils sit above the national median. The Hills sits 62 per cent above it, in a league of its own. And the Hawkesbury, for all its stagnation, still out-earns Penrith, the fastest-transforming council in the group. Growth has brought Penrith scale, a jobs pipeline and political weight. It has not yet brought its households a higher median income than the district next door, which grew barely at all.
Step down to the suburb level, and the picture sharpens, because the income spread within the Hawkesbury is wider than the spread between the four councils. Pitt Town's median household income of $2,707 a week is 85 per cent higher than South Windsor's $1,466, and the two suburbs are ten minutes apart. South Windsor sits below the national median. Pitt Town out-earns three of the four council-wide medians and is within $124 a week of The Hills. Every acreage suburb in the district, including Oakville, Maraylya and Kurrajong, earns above the Hawkesbury median, while the town centres that carry most of the district's renters do not.
Pitt Town's figure warrants a caution before anyone reads it as a sign of a district getting richer. In 2011, before the Vermont estate's main intake, the suburb's median household income was about $1,730 a week. Two censuses and nearly two thousand new residents later, it was $2,707: up 57 per cent in a decade when the district-wide median rose 43%.
Pitt Town did not get a pay rise. It got new neighbours. A new estate does not make a place affluent so much as import affluence, in the form of double-income families who can clear the price of entry. Marsden Park tells the same story at ten times the scale, and Red Bank will tell it again when North Richmond's 2026 numbers land.
Council borders barely register in household budgets. South Windsor's nearest income twin in this comparison is Mount Druitt, at $1,478 a week, just twelve dollars apart. Pitt Town's twin is Marsden Park, fifteen dollars apart. Oakville's closest match is Quakers Hill, a conventional suburb on quarter-acre blocks, $58 a week from a suburb of five-acre lots. In Penrith itself, the suburb around the station records $1,397, keeping company with South Windsor and Mount Druitt. Households with the same income, in four different council areas, on wildly different land: what that means for the rates each of them pays is where this series goes next.
The part nobody has to answer for
Earlier this year, the Gazette compared the economic development strategies of these councils, and the conclusion bears repeating now because the Census is the instrument that will mark the homework.
Penrith is the most exposed and the most accountable. It sets its targets in its Community Strategic Plan with dates attached: gross regional product growing from $12.19 billion to $30 billion, and a jobs-to-worker ratio rising from 0.80 to one-to-one. Those numbers lean heavily on the airport and the Aerotropolis arriving as promised, and successive censuses will publicly show whether they do.
The Hills is the most economically literate. It names its problem precisely, citing a 0.76 jobs-to-worker ratio and more than 22,000 educated residents commuting out for work, and answers with figures: roughly a $24 billion economy and around 56,000 new jobs by 2041. The targets sit in a companion Economic Growth Plan rather than in the strategic plan itself, but they exist and can be checked.
Hawkesbury is the outlier. Its Thriving Economy direction lists thirteen indicators but sets no targets. Its companion economic document, the 2020 Employment Lands Strategy, addresses land supply rather than growth. The plan reads well and cannot be failed, because nothing in it is pegged to a figure a resident could check in 2045.
Hawkesbury has the smallest economy of the four, and the one most constrained by flood risk, that may be a deliberate choice not to promise growth the valley cannot safely absorb. The steel in the criticism is this: Penrith shares the floodplain and shared the flat decade yet chose to put numbers on the public record anyway. Of the four councils, Hawkesbury is the only one whose ambition cannot be measured, and so the only one its residents cannot hold to account.
The Census does not care what any of them promised. On August 11, it will count the four communities the same way it has since 2001. From June 2027, the results will arrive in three stages, regardless of strategy documents. Penrith's jobs ratio will be published. The Hills' out-commuters will be tallied. And the Hawkesbury will learn whether a quarter of a century of standing still was a decision or just what happened while nobody wrote a number down.
One suburb at a time
Look closely at where the Hawkesbury's recent growth came from, and the district's story narrows further. Between 2011 and 2021, the LGA added 4,854 people. Pitt Town supplied 1,908 of them, roughly 40 per cent of the council area's growth from a single suburb, as the Vermont estate roughly doubled the town. Remove Pitt Town and Red Bank's first residents, and the rest of the district barely moved at all over that decade. Vermont was a developer's initiative, not the Council's.
The last time the Council itself drove growth was at Bligh Park in the mid-1980s: a joint venture between Hawkesbury Council and the State Government on Crown land, the classic model of the day, with the state providing the machinery and the Council serving as partner and planning authority. AV Jennings built much of the housing from around 1988. The primary school opened in 1990, and the main population intake occurred from roughly 1986 to 1995.
Set the two estates side by side, and a pattern emerges: the Hawkesbury grows in single-estate pulses about a generation apart. Bligh Park fills through the late 80s and early 90s. Growth stops. The 2001 to 2006 censuses record the district going backwards. Then the 2011 Vermont fires. Four censuses now show what a Bligh Park looks like 35 years on: a median income of $2,029 and 2.8-person households, the profile of a first-home-buyer estate whose original buyers are reaching retirement.
Red Bank at North Richmond is the next pulse and the single biggest reason 2026 might finally break the flat line. On the 2021 census night, only about 500 of its lots were registered, and even fewer were built and occupied; a rough calculation puts its contribution at 1,000 to 1,400 of the 67,207 people counted that year, a start but a fraction of the estate.
By census night 2026, the estate should be at or near its 1,400 homes, which means the bulk of its roughly 3,900 residents will fall between the two counts. Most of Red Bank's population will appear as growth in the 2026 figure. That estimate comes with the usual caveats, and the bridge over the river will carry every one of those households.
Which leaves the question the Census cannot answer but keeps asking.
For 25 years, the Hawkesbury stood still while its neighbours moved in leaps. Without one developer's estate at Pitt Town, the last decade would have been close to a standstill too.
Red Bank should carry the district through 2026.
Nothing is queued to carry it beyond that, and a community cannot keep leapfrogging forward on the back of whichever developer turns up next.
What worked once can work again: a Council-led release on flood-free land east of the river, clear of the bridge and the evacuation bottlenecks that shadow every western option. The Council built Bligh Park when it chose to. If the Hawkesbury is to keep growing, it will have to choose again.
Data notes: population, dwelling and income figures are from ABS Census QuickStats for the relevant year (Hawkesbury LGA13800, Penrith LGA16350, Baulkham Hills/The Hills LGA10500 then LGA17420, Blacktown LGA10750; suburb figures at SAL level). 2001 counts are place of enumeration; later censuses are usual residence. The Hills' pre-2016 rows reflect the former, larger boundary. Small-area figures carry ABS privacy perturbation. Pitt Town's 2011 income is derived from ABS Census data as compiled in published suburb profiles. Red Bank figures are the developer's published lot registrations and projections. Economic strategy figures are as reported in the Gazette's earlier comparison of the four councils' plans.